
Figure: Suspected drug toxicity deaths, by month, Sudbury and Manitoulin districts, 2018-2026
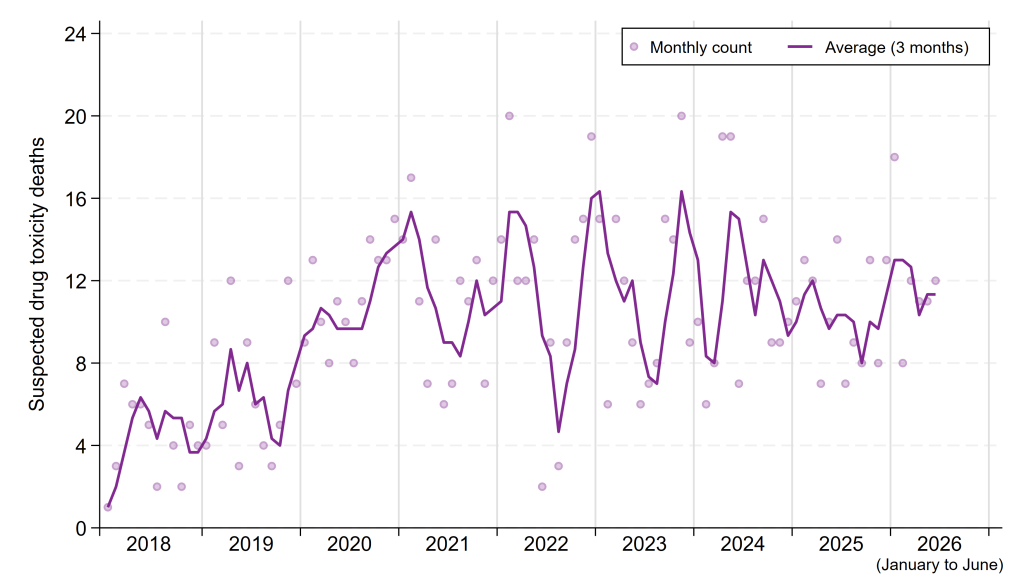
Table: Suspected drug toxicity deaths, by month, Sudbury and Manitoulin districts, 2018-2026
Note:
- Counts, especially those from recent months, are preliminary and subject to change.
- Suspected drug-related deaths include deaths where the coroner indicated that they suspect the death may be drug-related based on preliminary investigation (e.g., drugs or drug use equipment were found at the scene, history of drug use or naloxone use, physical signs of drug use, etc.). These deaths exclude death associated with trauma (e.g., injuries) and medical assistance in dying cases.
- Deaths are assigned to geographic areas based on the location of the drug poisoning or, when that is not available, the location of the death. Counts of deaths in Sudbury and districts may therefore include deaths of residents of other geographic areas who died here. Such deaths will introduce a small error into our calculated rates, the denominators for which are based on the estimated population of local residents.
Source:Office of the Chief Coroner of Ontario. Monthly Update: Suspect drug-related and drug toxicity deaths in Ontario [unpublished datafile], received June 25, 2026.
Figure: Annual rates of suspected drug toxicity deaths per 100,000 population, by geographic region, 2018–2026
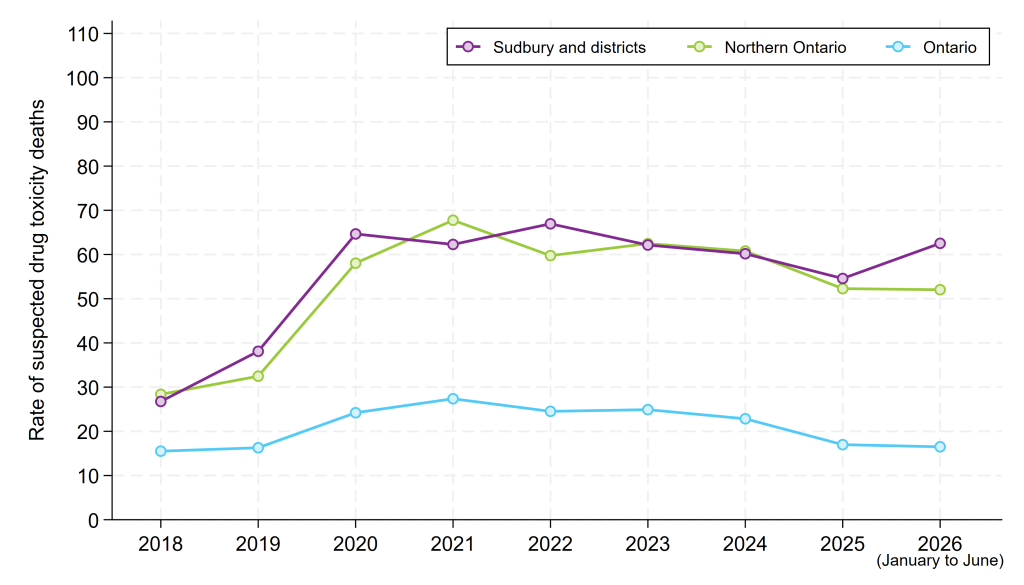
Table: Annual rates of suspected drug toxicity deaths per 100,000 population, by geographic region, 2018–2026
Note:
- Rates, especially those from recent months, are preliminary and subject to change.
- Suspected drug-related deaths include deaths where the coroner indicated that they suspect the death may be drug-related based on preliminary investigation (e.g., drugs or drug use equipment were found at the scene, history of drug use or naloxone use, physical signs of drug use, etc.). These deaths exclude death associated with trauma (e.g., injuries) and medical assistance in dying cases.
- Deaths are assigned to geographic areas based on the location of the drug poisoning or, when that is not available, the location of the death. Counts of deaths in Sudbury and districts may therefore include deaths of residents of other geographic areas who died here. Such deaths will introduce a small error into our calculated rates, the denominators for which are based on population estimates of local residents.
- The rates for the current year have been annualized to represent the annual rates that would be seen if the average monthly counts seen thus far in the year persist for the whole year.
Source:(1) Office of the Chief Coroner of Ontario. Monthly Update: Suspect drug-related and drug toxicity deaths in Ontario [unpublished datafile], received June 25, 2026, (2) Ontario Ministry of Health, Population Estimates and Projections 2021–2026, IntelliHEALTH Ontario, accessed March 20, 2025.