
Figure: Emergency department visits for confirmed opioid drug poisonings, by month, Sudbury and Manitoulin districts, 2018–2026
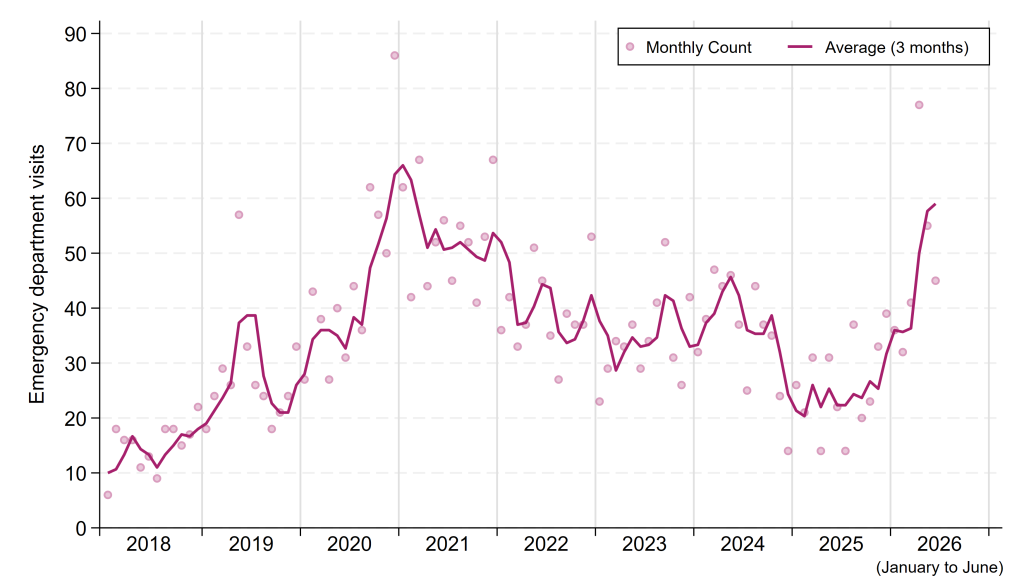
Table: Emergency department visits for confirmed opioid drug poisonings, by month, Sudbury and Manitoulin districts, 2018–2026
Note:
- Counts, especially those from recent months, are preliminary and subject to change.
- These data include all unscheduled visits to emergency department in the Sudbury and Manitoulin districts for which an opioid drug poisoning was recorded as the main or other problem. Unconfirmed diagnoses are excluded.
- Counts may include residents of other geographic areas who visited a local emergency department.
Source:Canadian Institute for Health Information (CIHI), National Ambulatory Care Reporting System (NARCS). Obtained from the Ontario Ministry of Health on June 30, 2026.
Figure: Annual rates of emergency department visits for confirmed opioid drug poisonings per 100,000 population, by geographic region, 2018–2026
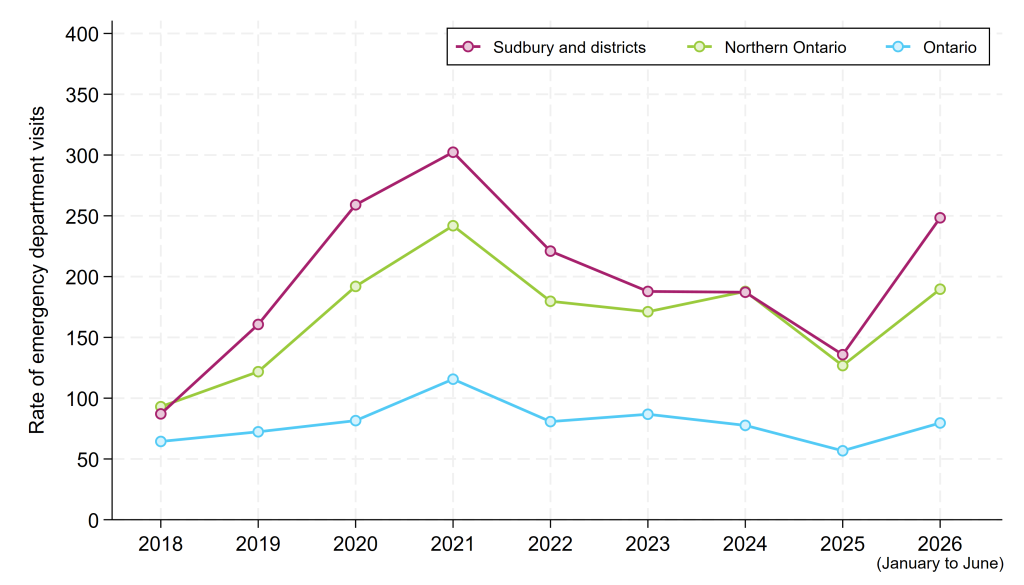
Table: Annual rate of emergency department visits for opioid drug poisonings per 100,000 population, by geographic region, 2018–2026
Note:
- Rates, especially those from recent months, are preliminary and subject to change.
- These data include all unscheduled visits to emergency department in the Sudbury and Manitoulin districts for which an opioid drug poisoning was recorded as the main or other problem. Unconfirmed diagnoses are excluded.
- These rates are based on counts that may include residents of other geographic areas who visited a local emergency department. This will have introduced a small error into our calculated rates, the denominators for which are based on the estimated population of local residents.
- The rates for the current year have been annualized to represent the annual rates that would be seen if the average monthly counts seen thus far in the year persist for the whole year.
Source: (1) Canadian Institute for Health Information (CIHI), National Ambulatory Care Reporting System (NARCS) [unpublished datafile]. Received from the Ontario Ministry of Health on February 11, 2026. (2) Ontario Ministry of Health, Population Estimates and Projections 2018–2026, IntelliHEALTH Ontario, accessed March 20, 2025